
This is a wrap-up of my practical Linux Tracing series. You can see older posts from this list:
- Part 0/5: Why did I trace?
- Part 1/5: Symbols, Debug Symbols, and Stack Unwinding
- Part 2/5: Profiling vs Event Tracing
Part 3/5: Strategies for Adhoc analysis
How to pick the right event[s] to drill down.
Preface
If you’re reading this blog, most likely you’re a fan of Linux tracing and BPF-based tools. Given its power, it’s very tempting to jump into your new shiny tools box to troubleshoot problems. Sometimes it works, but mostly it doesn’t. In this blog, I’ll share my own strategy to get the best out of our tracing tools. When should we use it, and how?
The very first strategy: think before you start
- You always start with an assumption about what will happen (event[s]). Tools help you to verify it.
- Check automated alerts with metrics, simple graphs for basic resource consumption, and application logs. If those tools can’t clearly verify your assumption. Then start tracing down more.
- Don’t start firing BPF tools immediately like an idiot.
An easy exception: when you know what to do
Yeah, it’s simple, right? Either you did it before ( and it works ) or you have a very clear simple task need to verify, and it requires tracing tools to solve. Just nail it.
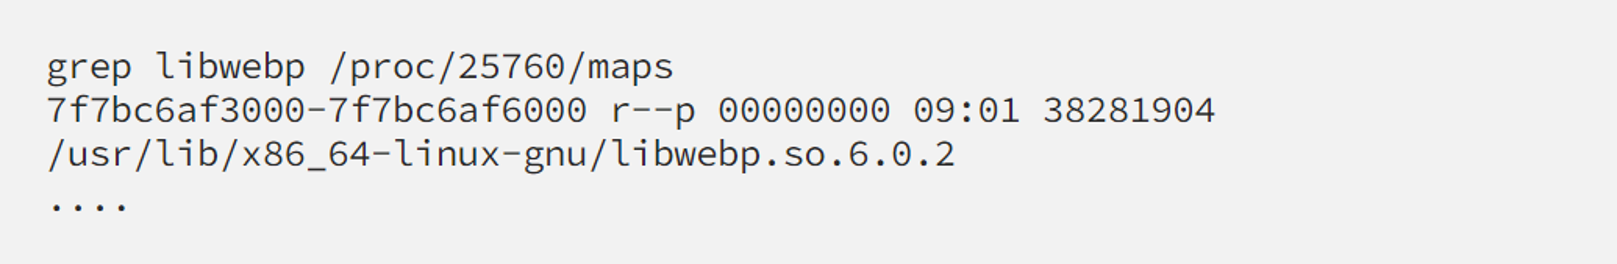
For example, recently I had to assess the impact of multiple libwebp vulnerabilities. Frankly say I don’t know much about this stuff, and most likely we don’t use it. But there are some PHP applications on some nodes that load it into its memory:
Now we need to know if there’s any function from that lib that is really executed at any time or not. Great case for showing off, bpftrace comes to rescue:
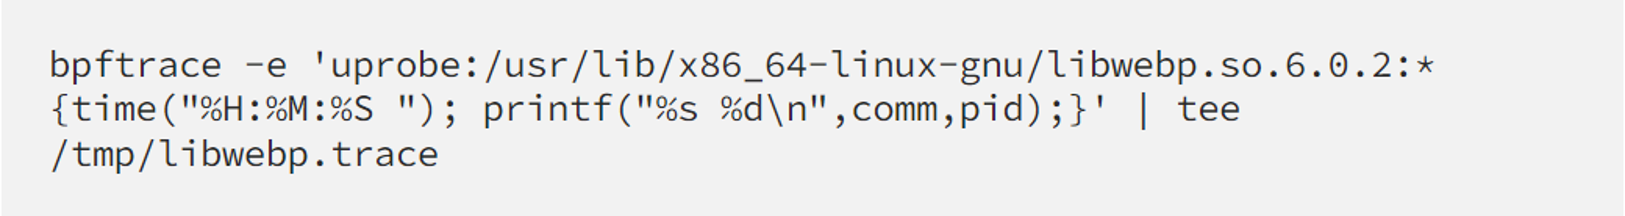
I let it run for days. Not even a single event. We can rest assured and waiting for the fix.
Sounds nice? But most of the time, it’s not the case. You usually don’t know exactly what to do. Your metrics and application logs are not enough. When your 2/3 pillars of observability failed, another easy choice is to start tracing. But to trace what? That’s the question.

Bombarding strategy
Start from the broad view, collect as much as you can, then choose specific event[s] to drill down based on:
Hot code
Profiling and visualizing ( perf / bpftrace profile + flamegraph, for example ), to get the full picture of on-CPU usage, pick the hot-spot (most frequently executed function, Flamegraph doesn’t show anything related to latency), and start drilling down to that specific function.
For example:
We once got a situation with our squid proxy when there was a sudden growth in our incoming traffic in the evening. The traffic could reach half of its capacity and then drop down like this:
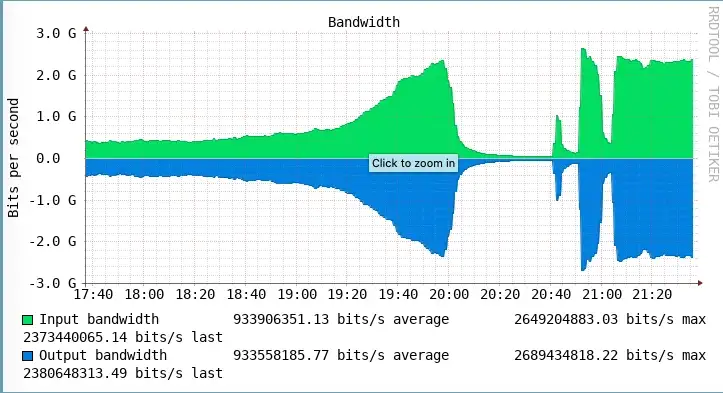
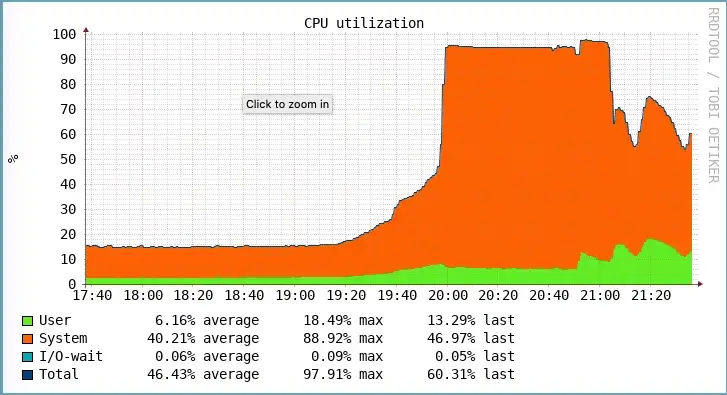
The CPU usage mostly from %sys
Info about TCP
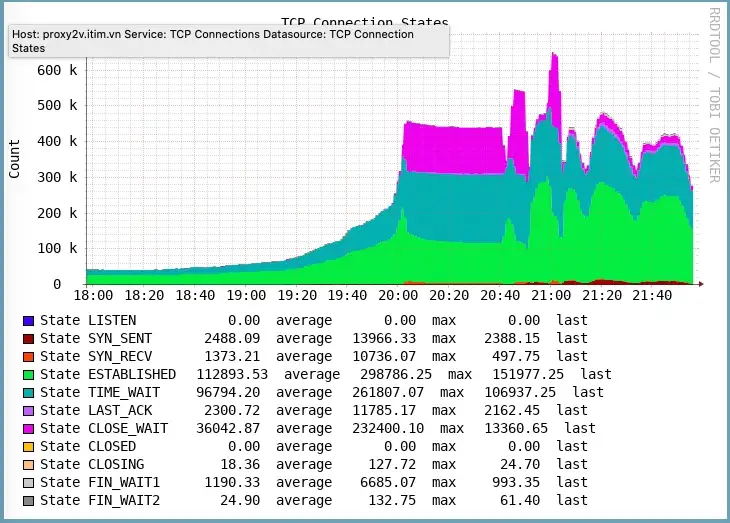
Just thinking something got stuck with TCP, start quick profiling and got the hot code
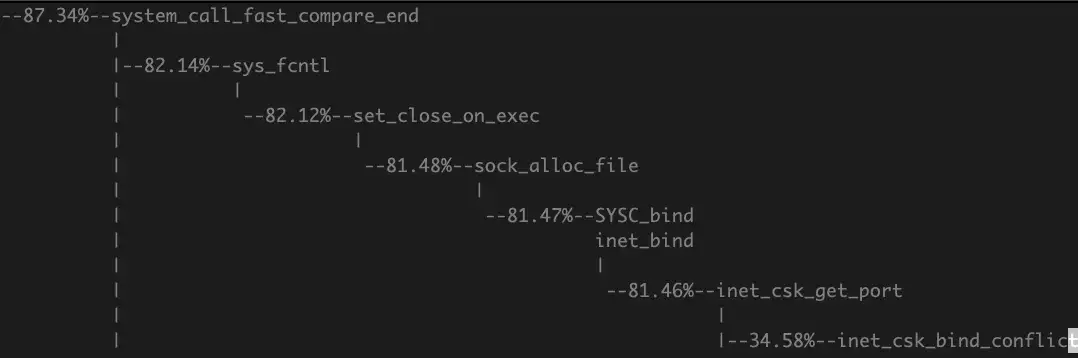
It called inet_csk_bind_conflict and inet_csk_get_port much more than usual. As we've been working with squid proxy for quite a while, this should be related to the situation when squid has to handle much more than a 50k connection to the remote host. The limit here is the source port (in our case ip_local_port_range set to 15000 65000). The squid itself does return some error message about “can’t bind socket” but not significantly more frequently than usual, which is pretty strange.
A simple fix is to avoid solving bind conflict, by adding more IP to the interface or even adding more interface to the box so it can handle the proxies requested more. We already add more IPs to our interface but turned out it was not enough, so we added more, and the problem was solved.
Slow code
Collecting a broad group of events, with info about it's latency, pick out the ones which have a latency outlier and start examining its details. The same technique is implemented by funcslower.py or funcslower (ftrace version).
An important note on this: the slow code most likely is the result of being off-CPU ( voluntary to wait for IO or involuntary by CPU scheduler ). So sometimes tracing a slow code turns out to be tracing context switch-related events.
***
The bombarding strategy’s biggest problem is overhead. Profiling too many events at a high rate can affect your performance significantly. But doing it at a low rate may lose the important details.
To solve that issue, we need to find a way to narrow down our possible targets.
Narrowing down the target
By examining the source code. Don’t worry, it’s not as complicated as it sounds. We can do it by:
- We can always start from the application log. By using an error message or info from the access log of your application as the query to search from the source code, we’ll find exactly the function which produces the message to drill down.
- Searching by function feature: normally, the function name is quite self-descriptive. By searching the source code with some keyword of the feature we’re interested in, we can find the related function quite easily. I personally find livegrep or cscope are very useful for kernel source searching. And github search feature is also good enough in general.
After having the targets narrowed down, we need to reproduce the bug/issue (isolated env is preferred) and then start tracing those events for further investigation.
For example, we once met a weird problem with bind DNS, when the negative record caching doesn’t behave as expected.
A simple search query like this lead me to a function definition we may need: https://github.com/isc-projects/bind9/search?q=negative+cache
dns_ncache_* should be our target for tracing.
A quick check on named ‘s libraries will show us more info about our tracing target:
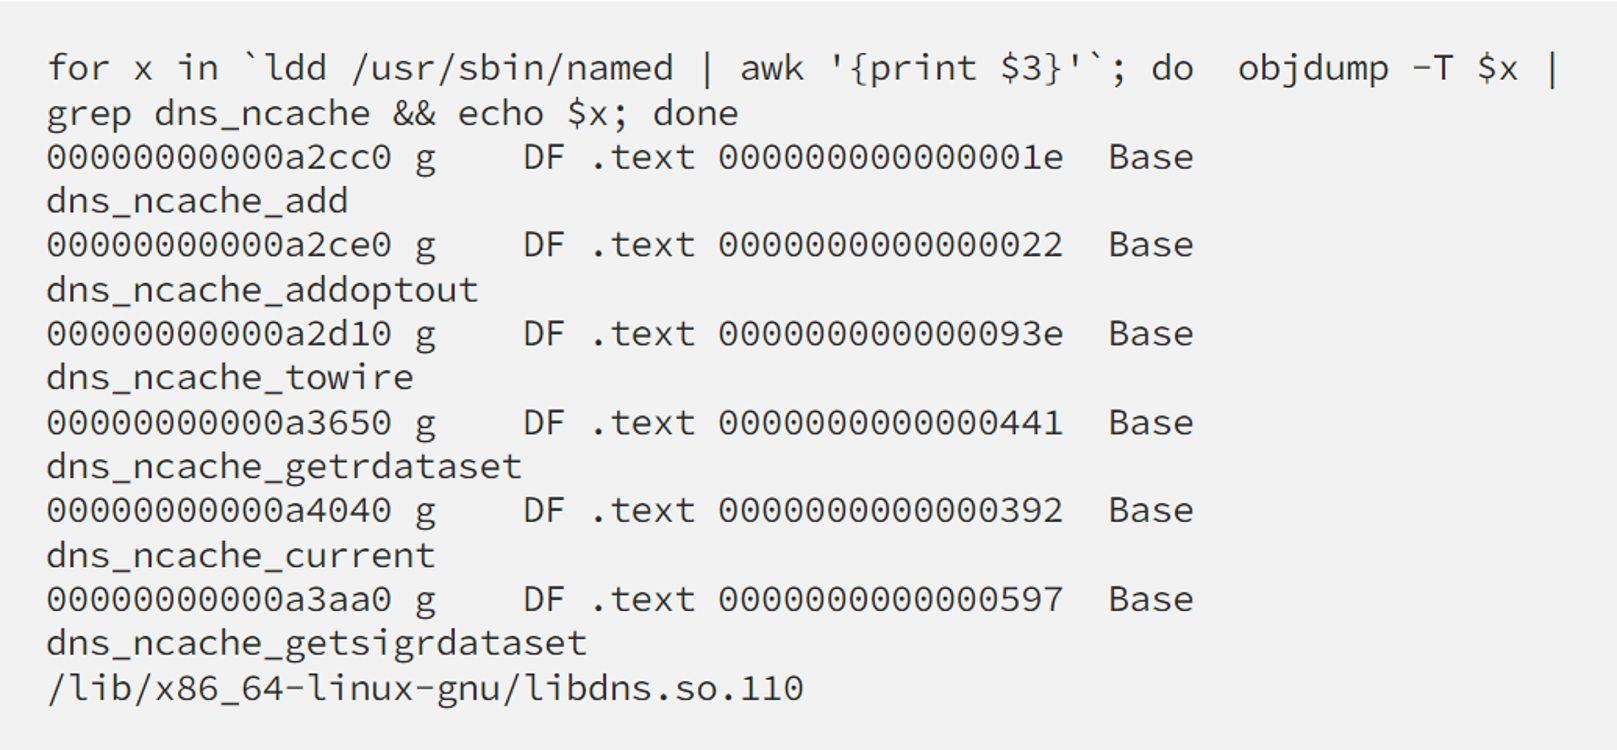
Having targets on hand, we can those events while replaying our requests to reproduce the case.
I actually couldn’t figure out the root cause by tracing because my colleague was quicker to find the root cause with this buggy patch when min-ncache-ttl swapped minttl with maxttl in the wrong way. But we were close, and having knowledge about the events, we can verify the assumption easily on the fly.
***
Conclusion
It’s difficult to form a formula to solve ad hoc problems. As it’s Adhoc, we should just aim for accumulating experiences along the way. The best strategy turned out to be improvising only :)
What I wrote above is a small summary of how did I deal with my case along the way that is reusable. Sometimes we still need luck (and hours and hours of researching) to really figure out the root cause, especially the root cause of an interesting issue. Hopefully, this blog can give you some clues to start on the very first steps of your tracing journey. Looking forward to your feedback on this, as well as to listening to your war stories in your own way.
Part 4/5: Tracing container workload
The similarity and difference in comparison with a normal workload
TL;DR
Same same:
- Tracing kernel events (syscall, kprobe, tracepoints) works in the same way.
- Profiling user-space program by perf works in the same way (Linux 4.14+).
But different:
- Namespaces prevent tracing user-space events by kernel tracing infrastructure. (As tools and binaries/libraries are isolated by different mount namespaces).
- Distributed tracing (Eg: Opentelemetry / Opentracing + Jaeger) to rescue.
Prerequisite
This is the 4th article in my (messy) practical tracing tutorial series. You should be very familiar with tracing/profiling and tools like strace, perf, bpftrace, and its various tools. Otherwise, I highly recommend starting from the beginning.
And obviously, we also need to have experience with container workload as well. Not much though, knowing buzzwords like docker, Kubernetes, Linux cgroup/namespace… is enough.
By saying “container workload”, I mean just an application running inside a container, using containerd runtime (directly or through docker engine), doesn’t matter what the orchestration solution is (k8s like us or openshift, docker swarm, or mesos…)
The similarity
A process on the host OS and inside the container both simply are processes. And they share the kernel part. Thus, tracing that process with kernel-related events like syscalls, kprobe, and tracepoints are all the same.
For example, syncsnoop.bt is still working well with container workload:
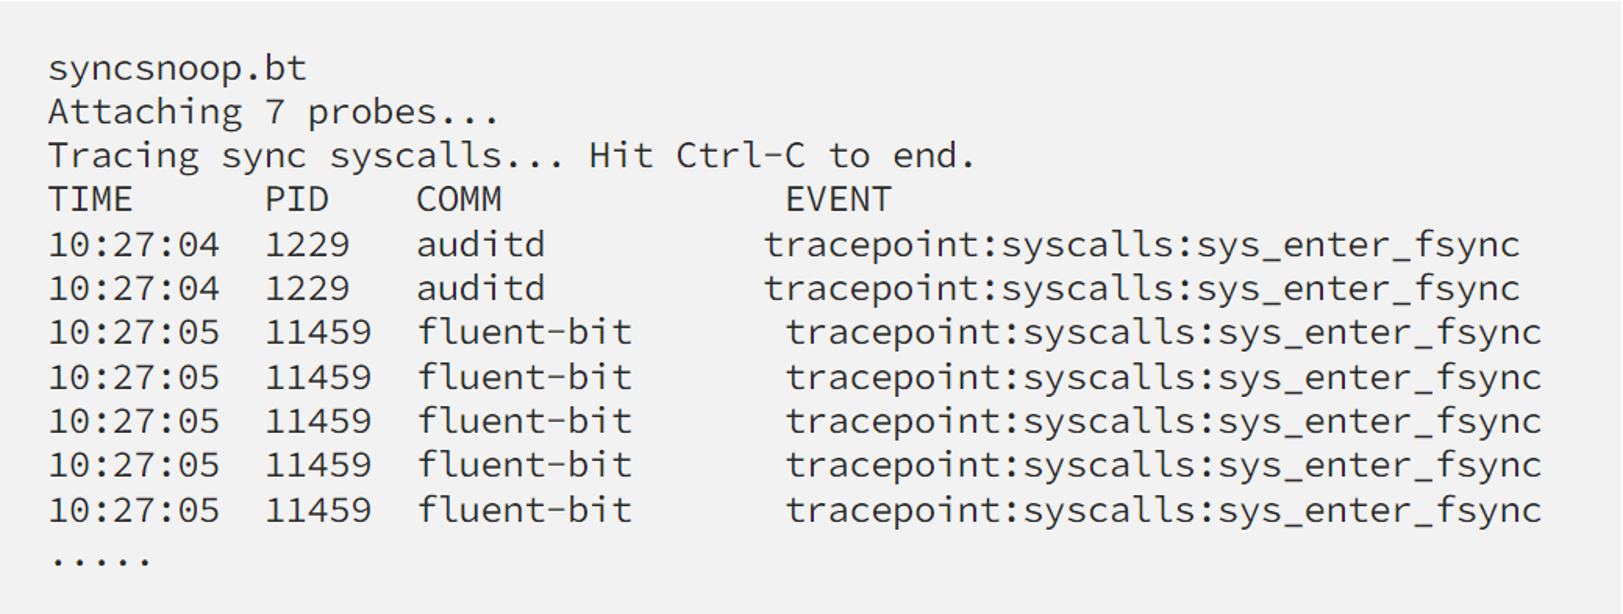
In this snippet, auditd is running on the host OS while fluent-bit is a container workload, which can be verified by checking its NSpid like this
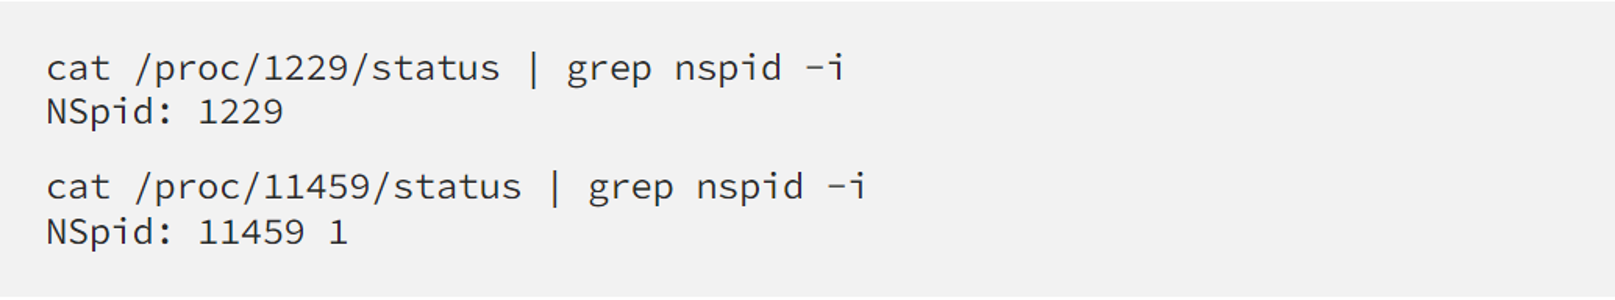
Here auditd has only 1 PID 1229 but fluent-bit has two of them (11459 in the “main” pid namespace and 1 in its own namespace.)
As you can see tracing tracepoints works in the same way on both processes.
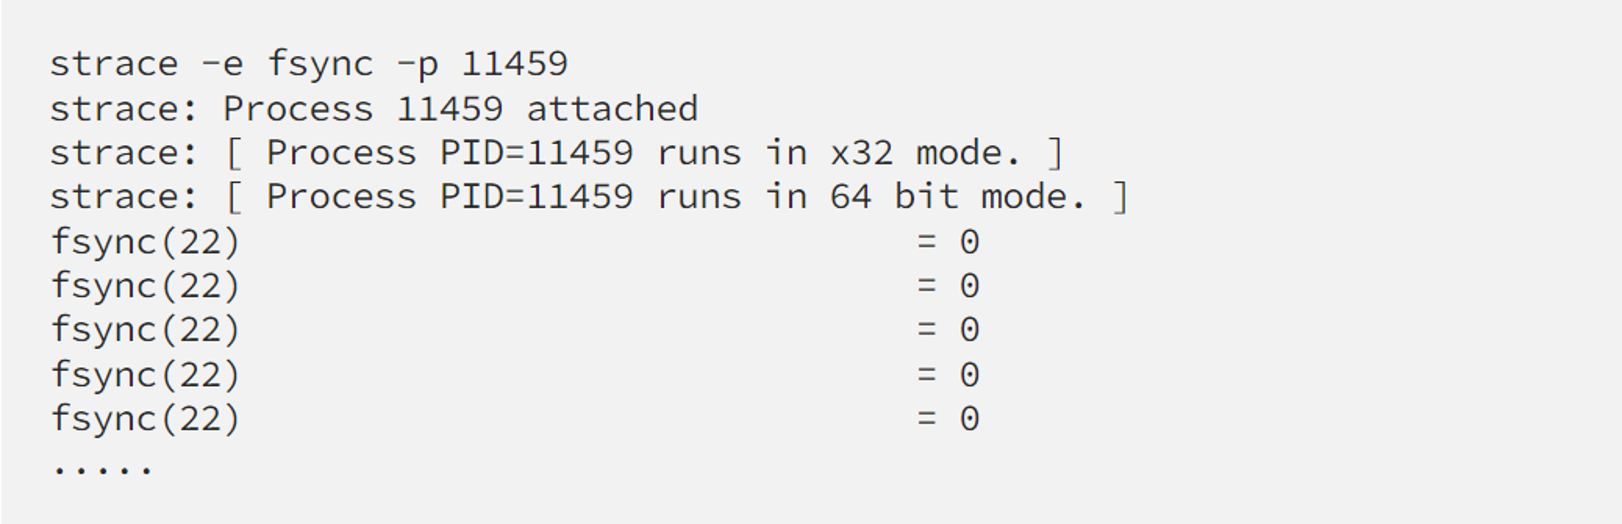
The same thing with syscall and strace, as a simpler example:
The difference
The container workload has its own namespaces. (See this if you’re not familiar with it. Feel free to suggest me a better article as a reference). In the simplest way, we can say that it has its own root filesystem, with its own software version. The binaries and libraries are isolated with our trace tools.
You can quickly realize here that we’ll have trouble interacting with the user-space application. For example, bpftrace on the host OS can’t reach the binary or .so file inside a container to inject an uprobe, thus we’re losing our superpower to look into any running application on demand.
What can we do in this case?
Stick to the old way: perf is “namespace aware”
Since linux v14.4-rc1. It means, perf since version 4.14.4 can detect if the binary that it’s profiling belongs to another namespace. If it does, perf can examine the binary’s symbols from its namespace automatically for you and give you the stack trace as usual.
So, fortunately, profiling with perf still works in the container.
Back to the example with fluent-bit above, we can profile it as if it’s a normal process on a host OS:
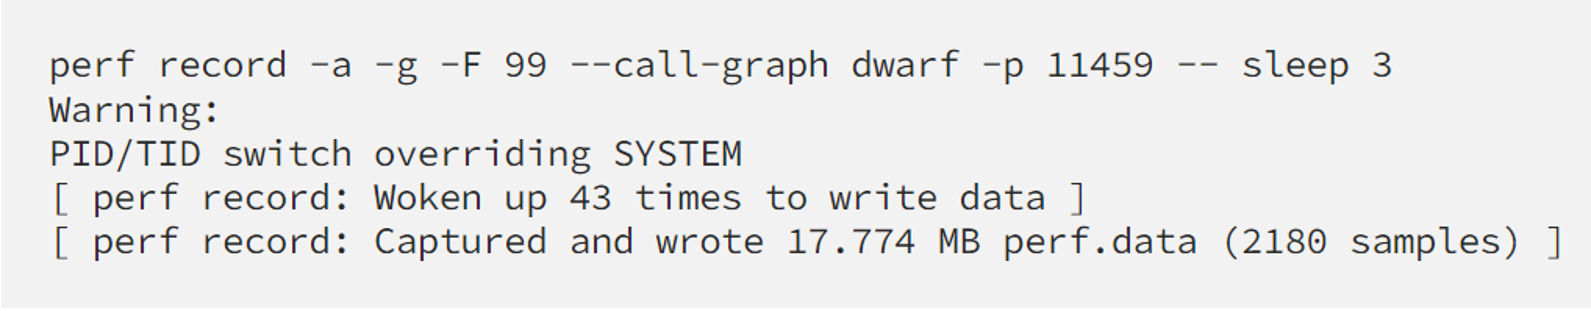
perf script shows us strack trace like this
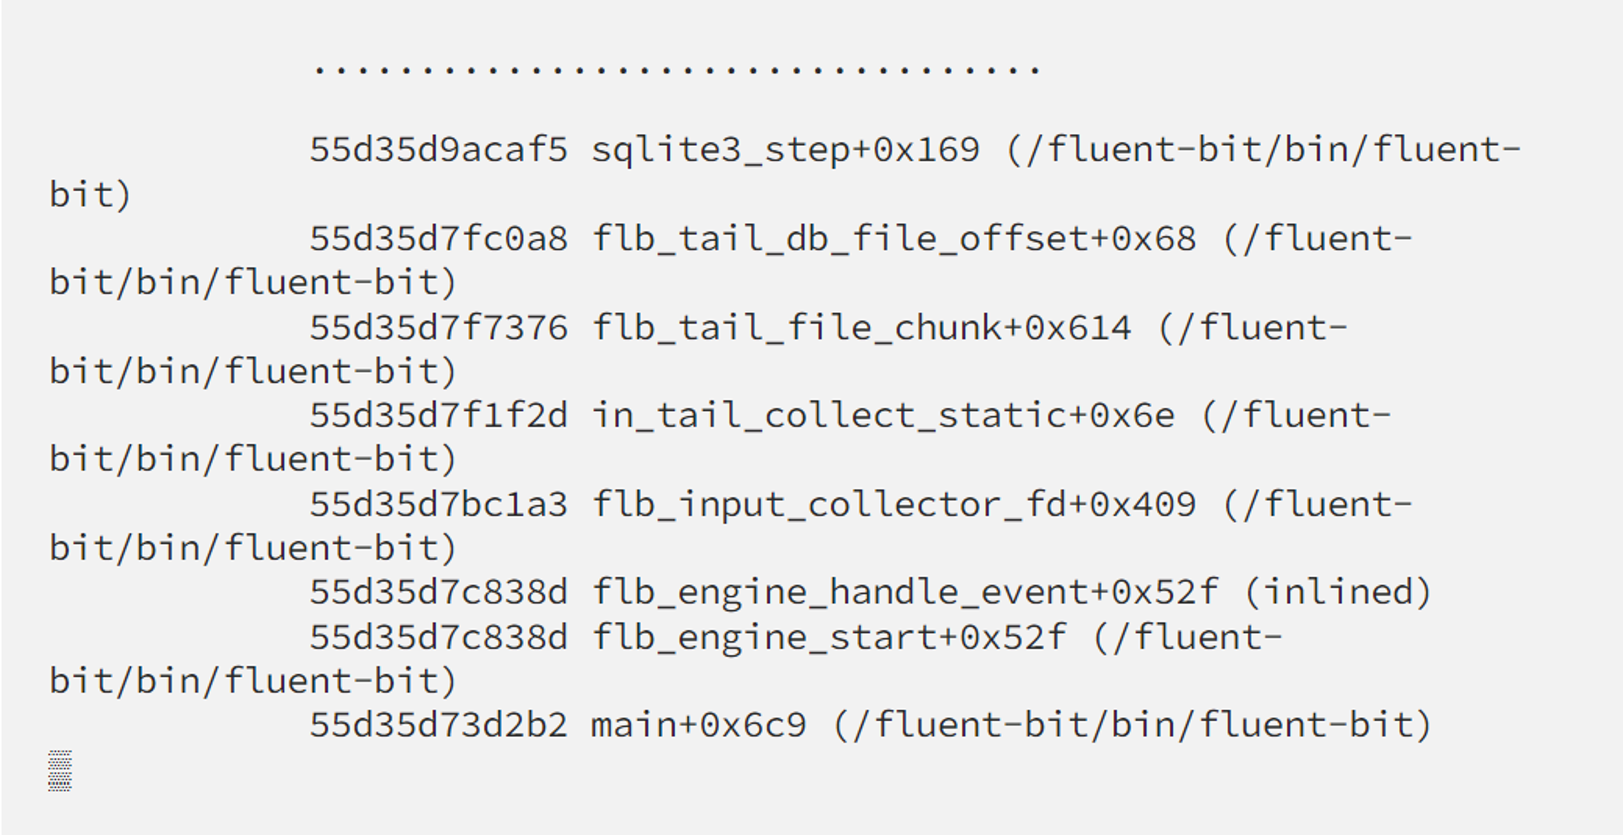
So no matter in which namespace a process is running, profiling with perf still can provide us useful info about strace trace. There’s still the case you will have a broken stack like this:
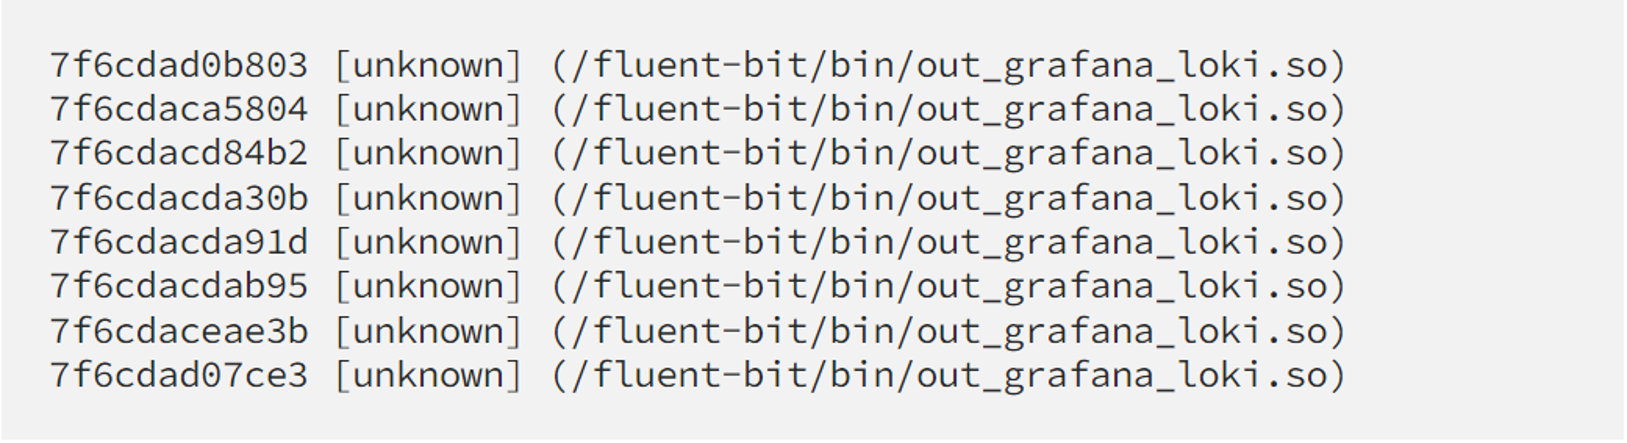
but it’s actually the same old problem with missing debug symbols in binary, don’t blame the container for it. You may want to revisit my first blog to fix this issue.
If profiling with perf isn’t enough for you, there are other options you may want to consider.
Running tracing tools from inside the container?
Some may suggest installing our trace tools inside a container and running it from the inside but I am against it, because:
- It can increase our container image’s size significantly.
- We don’t always own the image. Cooking them from a third-party image with perf/bpftrace tools is usually troublesome. Sidecar containers with tracing tools can help to avoid changing app images, but it poses another serious drawback: 2 containers have to share the rootfs (mount namespaces) which is not easily done to my knowledge.
- There are various security settings to adjust in order to give tracing tools inside the container to gain the same privileges/power as the ones in the host OS. Not always possible though, depends on how you set up your cluster and its security policy.
- Even if we have tools inside the container, we still need to merge all the user-space symbols inside the container with kernel ones from the host OS, by mounting data from either side.
It’s possible though, but it’s just not what I recommend.
Distributed tracing AKA end-to-end tracing
The distributed problem requires a distributed solution. perf and bpftrace are super cool for kernel tracing on a specific node, but it’s not designed to solve the distributed problems, I believe.
If there’s a tracing solution that can solve our problem with instrumenting container workloads, it should be able to collect:
- Application events.
- Across not only namespaces boundary but also hosts boundary.
The distributed tracing infrastructure should support:
- Tracer library instrumentation in different languages to trace different applications.
- Collecting events over a network, from different pods, on different hosts.
- Process, aggregate, store, and visualize all those data in a central place.
Fortunately, there are many solutions for it in the market already. If you’re new to this area, read more about it in the following articles to get more info about distributed tracing:
- Introduction to distributed tracing by Lightstep.
- Five years evolution of opensource distributed tracing by
Pavol Loffay
Distributed tracing is definitely worth its own (lengthy) article but it’s out of scope here.
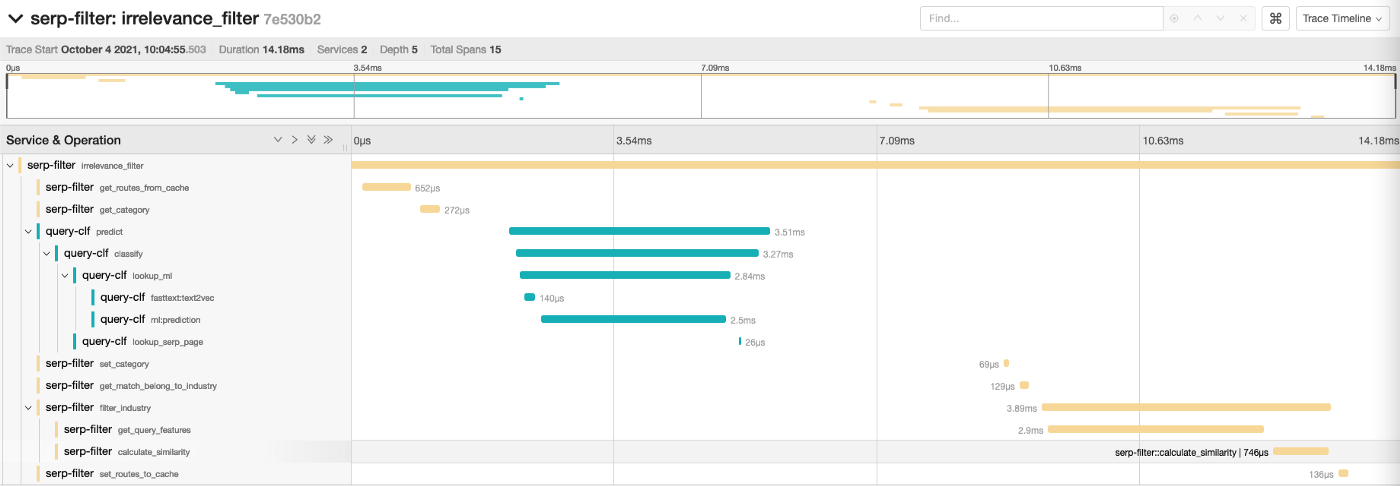
In our company, we chose JaegerTracing as our backend solution (agent/collector, storage, visualization), in combination with opentelemetry as instrumentation libraries to trace container workload.
Each of our application function latency is recorded and put in the context of the same request like this.
As usual, there are pros and cons in comparison with our “lower-level” tracing tools.
Pros:
- Solve our container working tracing problem! Now tracing works across namespaces/services/hosts boundaries.
- Provide useful context of an event: between events inside a service, inside a request which runs across different services (thus a name end-to-end tracing)
- Solve the problem with interpreted/scripting language (Eg: PHP, Python...): We now can look into specific events instead of execute_ex for PHP or _PyEval_EvalFrameDefault for Python.
Cons:
- An extra effort to set up a distributed tracing infrastructure, obviously.
- Performance overhead: eventually its user-space instrumentation, can’t compare with the speed of a BPF-based tool. And it depends on the language-specific implementation of opentelemetry SDK/API. We have to make a trade-off between performance vs feature richness here. Though distributed tracing solutions support different sampling mechanisms to handle this in a flexible way.
- Event (span) in distributed tracing tool ) is a kind of user statically-defined tracing (USDT) in the kernel tracing world. There’s no dynamic uprobe superpower.
Conclusion
In summary, this is what I would recommend you while tracing container workload:
- Understand the “namespaced process nature” of a container. Use the perf/bpftrace tool still to debug the kernel-related issue that may affect your container workload. ( CPU contention/starving, cgroup throttling, unnecessary/abnormal syscalls, extra unwanted IO … )
- Implement distributed tracing solution to trace application-specific events. Use jaeger and opentelemetry as we do if possible, so we can discuss it and grow together ;)
Part 5/5: My final recap for Linux Tracing
What I’ve learned so far about tracing!

This is a wrap-up of my practical Linux tracing series. In this final write-up, I’ll change my style a bit, to make it more straight to the point. Here are my top 10 key takeaways after some time working as a Linux Tracer:
1. Tracing tools, techniques, and data (events, traces, spans…) are means, not the end result. What matters is how you interpret them to understand your situation and root cause.
2. Tracing is basically to know what your service/application is doing. Eventually, the truth lies in the source code. Be prepared to read somebody’s code always.
3. Nowadays the data we can collect is huge, find a way to visualize and analyze it. Trace with a plan in your mind. The raw data only is way beyond your cognitive ability.
4. Tracing or performance tuning is not an overnight task. Just like hacking. The success you see is the result of weeks or months of research. There’s a quick win sometimes but the big win usually requires you to understand your system thoroughly. No pain no gain.
5. On the other hand, there’s nothing wrong with “script kiddies” if it helps. Many top engineers in the field goal are to try making tracing or debugging much easier every day. (By sharing knowledge and making tools).
6. If you want to leverage tracing as a quick method to solve your production issue, invest in tracing infrastructure (eg: tools, libraries, storage, even third-party solutions…) and making your application tracing-friendly ( eg: integrated instrumentation libraries right from the start to expose useful data ). Thus, Implementing distributed tracing for the whole organization requires a culture shift. But it’s worth doing that.
7. Tracing is cool, but solving production problems on time is much cooler. Root cause investigation can wait, sometimes workaround to mitigate damage should have higher priority. This is where simple things like change management or a quick conversation with your fellow developers are really helpful.
8. Always think about overhead while tracing. If you can’t measure it very precisely, start small (eg: profiling with low frequency, recording a few events, in a short time), observe the impact then increase things gradually.
9. Tracing is mostly about finding errors. So be humble and professional while reporting it to the author of “not-very-optimal code”. The tracer should have clear evidence or proof of concept while presenting the error. If you’re not that sure (quite often), sit down with your colleagues and ask for their help to verify your assumption, nicely. Sometimes a tracer needs to have very good convincing skills.
10. Tracing is fun and addictive.
Preferences
- https://www.brendangregg.com/Slides/LISA2017_Container_Performance_Analysis.pdf
- https://ploffay.medium.com/five-years-evolution-of-open-source-distributed-tracing-ec1c5a5dd1ac
- https://lightstep.com/distributed-tracing/
Thank you for reading my messy blogs!