
Recently I had a presentation for my team about bpftrace, which I think it’s very cool. It turns out that nobody likes it. Mostly because of my presentation skill, I guess. Though, the biggest questions that were asked always start with "why".
- Why do I need this thing?
- It’s cool, but it takes effort to learn some “low-level things”, why should I do that?
And I also asked myself, why do I want to share this with everybody?
- This is not a regular technical post. This is a story.
“What will you do if this service is broken?
You CALL ME”
My developer fellow yelled at me on our skype group when I asked him for info in detail about the internal implementations of his software. Maybe I'd asked too much, and he got angry and told me so. He was right, so I shut up.
In Cốc Cốc, we sysadmins run our production services. We’re in charge of it. Being paid to do it. Take responsibility for it. That is why I want to know as much as possible about what I'm responsible for.
But that’s difficult. I can’t write lines of code like those developers are doing, obviously. I even can’t understand it. I only know some of the symptoms when things go wrong. But still, that's not enough. If you can imagine doing the job I do, you will be frustrated when these moments come: Looking at the top screen, seeing all CPU cores are consumed, some processes that are using 1xxx % CPU, and don’t know what to do. (Even now, I still have to encounter these situations, sometimes.)
So when my colleague was angry at my questions, his sentence banged my head hard. Many days after, I would still be asking these same questions:
- What am I doing here?
- Do I do whatever the developers tell me, like a robot?
- Can I live with black box services forever, and call out our developers whenever something goes wrong?
The answer is: Yes!
Maybe I had been doing just that for a long time. Until one day, one of our critical services had an intermittent issue - nobody knew why, and even its creator didn't know what went wrong.
I spent several days looking at atop output, checking every change in each 10 seconds sample that we had around the time that problem occurred. Every difference between 10 seconds, I took a note about it. Then somehow I found the page scan rates were significantly high around the time of the problem, which led me to this great article HERE about NUMA and page scan. It set zone_reclaim_mode to 0 and the problem was gone.
I was very happy so I started telling myself that this is exactly what I need to do more. I started digging more into our system. And I was lucky because at that time we had a system with good scale, having a very professional team that could do a lot of optimization. With the help of the developer colleague that I mentioned above (he’s one of the coolest guys that I have worked with so far), I learned a lot about filesystem, pagecache, huge pages, memory allocation (tcmalloc, jemalloc), JVM (gc and JIT compiler).
But my tweak usually didn’t work well. I couldn’t measure it precisely. Because most of the things in my area of responsibility are inside the kernel. I realized that I just can’t randomly "poke" around anymore.
I need to understand the Linux kernel more!
But how? By reading books, of course. This one, that one, and then another one.
Hmm, okay, but it’s "super slooooow" progress. It’s very difficult for me to understand all the concepts, not to mention the codes, data structures, and algorithms inside. I need something more… practical. Something that can give me a better view of my system, and specifically, view in real action.
That’s when I found Brendan Gregg blog, and I entered the Linux tracing area.
Over years, with his great effort with perf, ftrace, then the born of BPF tools, we now can have a much better view of our system. We can do things that we (as sysadmins, not kernel developers) can only dream of before.
- My NUMA issue mentioned above can be traced easily by numamove.bt.
- Want to know the per-process pagecache hit / miss ratio? Use cachetop.
- Need to profile Java application? No problem, Perf can help you THIS way.
- How to analyze the CPU contention that may affect my service? You need something like 30 lines of code with bpftrace version of offcputime.
With the help of tracing tools, now you will be able to know what is on CPU, off CPU, and what put your process to an off-CPU state!
With the growth of the Sysadmin community, for tracing both user space and kernel space, now I have more things to check instead of banging my head onto the top screen. I should know which code is being executed, how is it executed, and why it is executed. If I don’t understand the code myself, I can show my fellow developers the info about their code. It’s much better than the quote on quote: "Your service is using a lot of CPU now."
I believe this should answer the question: Why do we need to trace and why do we need to study the “low level” stuffs?
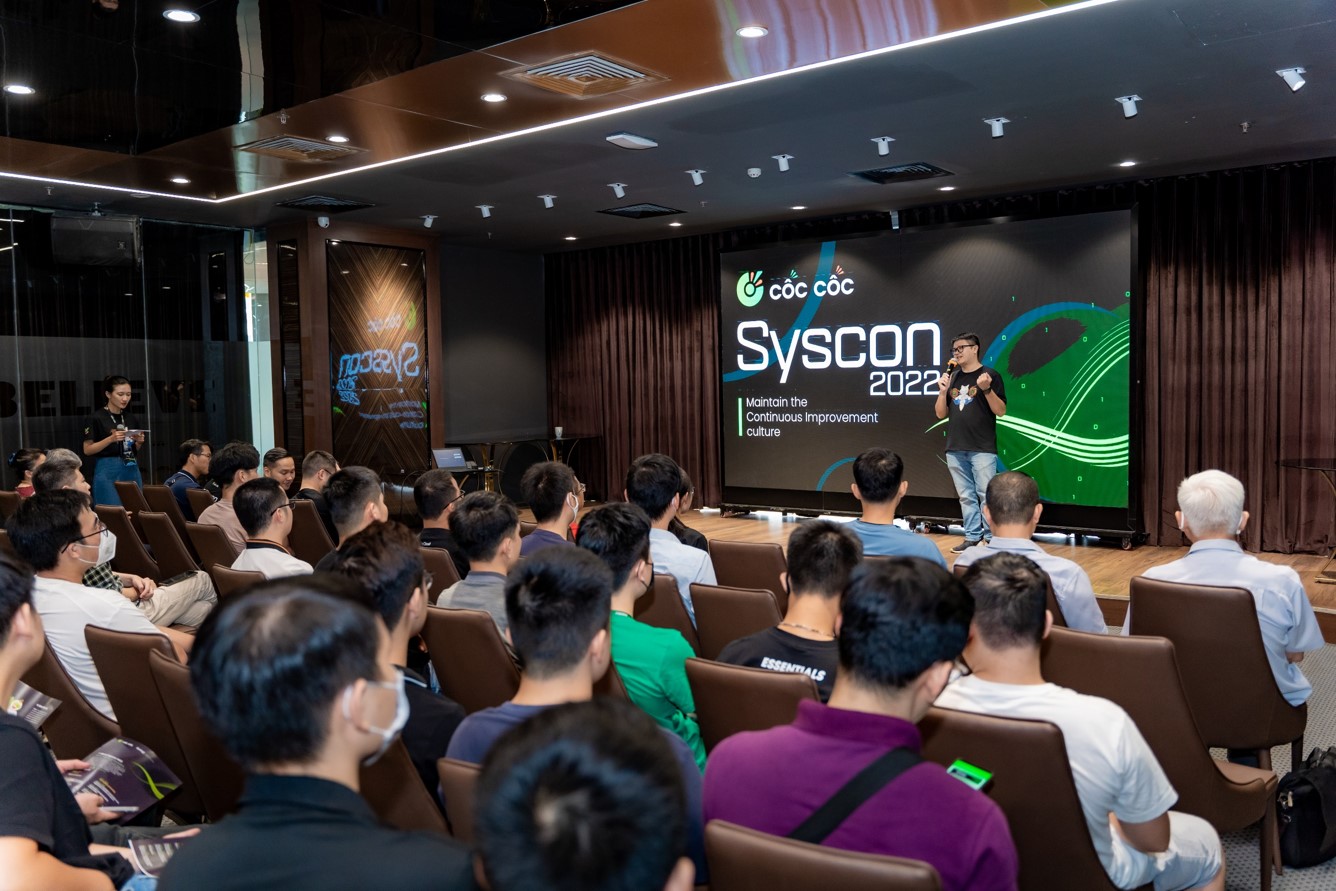
Every Syscon, Mr. Tung is always joining as a speaker, sharing his knowledge.
“You should go back and do your job”
Once again. I got this from another developer in my company. When I showed him the flamegraph of his application. And asked him to check it, because something didn’t look right. He told me before that I just need to dig deeper, instead of just calling him.
That’s true. It’s not my job. I should care about the kernel part only. And once again, I was silenced. He continued working on that, but still, now, that problem is still a mystery.
Fast forward ... 2 years later,
Till now, I still think we should trace it :) if it can help to solve our problem. If we (both sysadmins and developers) had tried everything and nothing helped, then why not just do it?
Perf_events, uprobe, or UDST may reveal something that application metrics / log may miss. On-the-fly event tracing can be very helpful with source code analysis.
The best scenario, in this case, is to work together. By using Linux tracing tools, I can give a developer internal activation records of his process, with the ability to zoom in on many functions with proper debug symbols. And based on that info, he can check more in his source code, to compare what’s in his mind versus reality. But only: If he understands the benefits and trusts my Linux tracing tools!
The thing is, most of the standard tools are not mine, it was developed by professionals in giant tech companies, with many different use cases. I can only understand the mechanism in the background and choose to trust it.
What I need to do now is to introduce it to people, and convince them to use it. This answers the question: Why do I need these Linux tracing tools, and share them with everybody?
- To understand it better, to troubleshoot quicker, to debug more precisely, together with my dear developers.
- To provide run-time statistics, for better troubleshooting than I am can help to solve problems.
I failed at this so far. Thus this blog happened.
Conclusion
If you read this far, I hope that you can see why I trace and have your own answers to other questions that I raised at the beginning of this blog.
I made this draft a long time ago, and never sat down to check it again to finish it till now. Since that time, I had been busy with other projects that took a significant amount of my time for tracing, but every time I tried to finish this blog, I’m in the flow. And tracing jobs, in turn, did give me back some magic moments that no other jobs can compare. Thus, I’ll keep writing tracing stories no matter if they can (yet) convince or impress others or not, because tracing does help me to solve my problems, and more importantly, it sparks joy in my jobs.
Then, why do I trace? To dig deeper, to understand the root cause, to solve hard problems. And for my own fun.
***
For many articles on tracing and stories of the everyday working of Mr. Tung Dam, Cốc Cốc Head of Infrastructure and Support Department, please continue to be notified on our latest blog!
For more of Mr. Tung Dam's sharing: