
Disclaimer
I’m not a professional tracer. What you are going to see here are the results of my adventure so far with Linux tracing tools. I’m still learning them every day.
Most of the background concepts you’ll see are simplified, maybe oversimplified to let us understand them more easily so we can focus on the main purpose: to know what our system is doing. The complicated concepts will be explained by references from other professional guys who know it much better than I do.
I’ve been strongly inspired by Brendan D. Gregg since years ago so don’t be surprised that you will see many references from his work.
Prerequisite
You should be familiar with tracing tools. In general, they are tools for troubleshooting or performance tuning, besides old-but-gold *top and *stat tools. To name it specifically, we’re doing to play with Perf, bcc-tools, and bpftrace in this, hopefully, series of blog posts about Linux tracing.
If you have no idea about the tools that I am talking about. You should read this first: Link 1 - 2 - 3 - 4
This is part I of my practical tracing series.
Symbols, Debug Symbols,
and Stack Unwinding
Why would we care about all these things?
So, if you read all the links above, you’re feeling highly motivated. Let’s jump to profile something, make a beautiful (1) FrameGraph (2), and see how our application is doing.
Let’s try to pick a sandbox, install Nginx server there, start a stress test, and start profiling from 1 Nginx worker first:
[root@tungdam10-virt.dev:~/FlameGraph]# perf record -a -g -p 13000 -- sleep 5
|
Make a FlameGraph for further performance analysis like a pro:
[root@tungdam10-virt.dev:~/FlameGraph]# perf script | ./stackcollapse-perf.pl |
|
But the result looks not really promising like this:
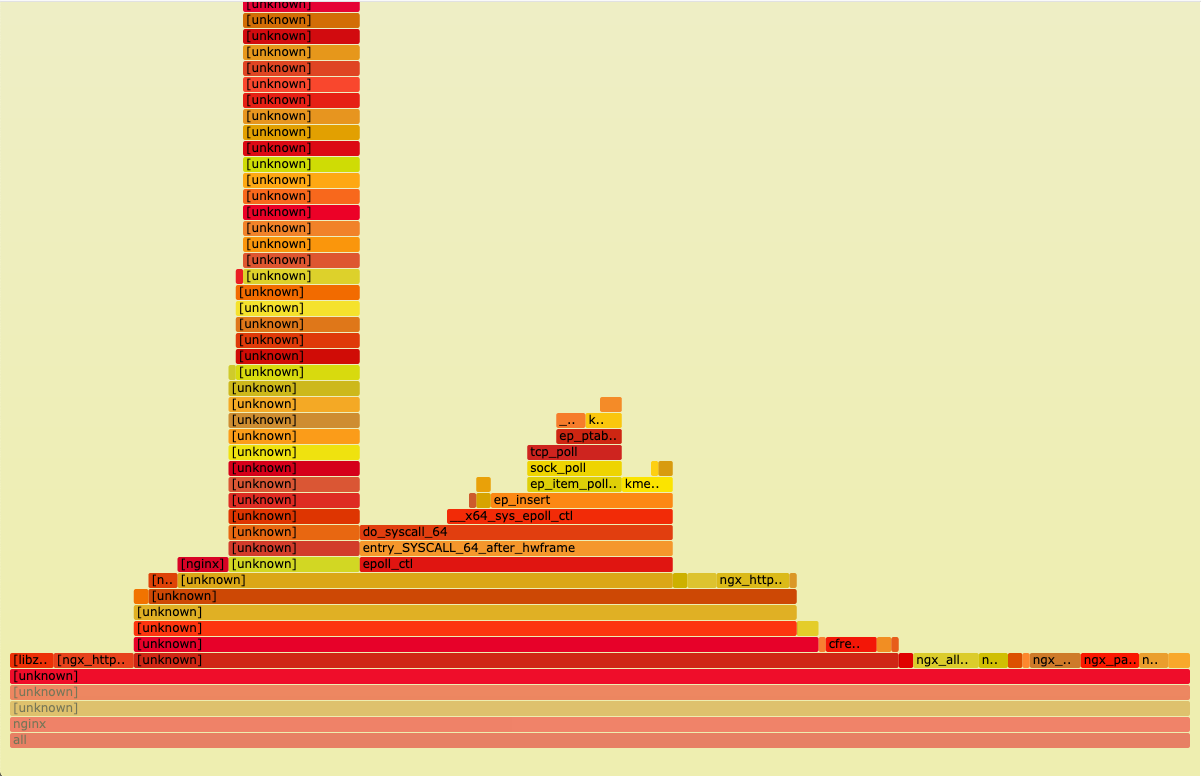
Super useless Nginx FlameGraph
Well... Instead of having something to tell you: your Nginx is using the function cool to call function fantastic , your debug process tells you something like unknown unknown unknown . That’s sad.
TL,DR:
- What happened? You have some missing symbols
- How to fix it: install some package that contains debug symbols, both for your Nginx (nginx-dbg) and its shared libraries (for example zlib1g-dbg or even
libc6-dbg) - Profile your Nginx again, your FlameGraph will look something like this:

Much better Nginx stack traces
- It has better info about functions but looks like most of the are kernel-related. Ok, let’s profile your Nginx again, this time with
--call-graph dwarf, it should give you an even cooler FlameGraph.
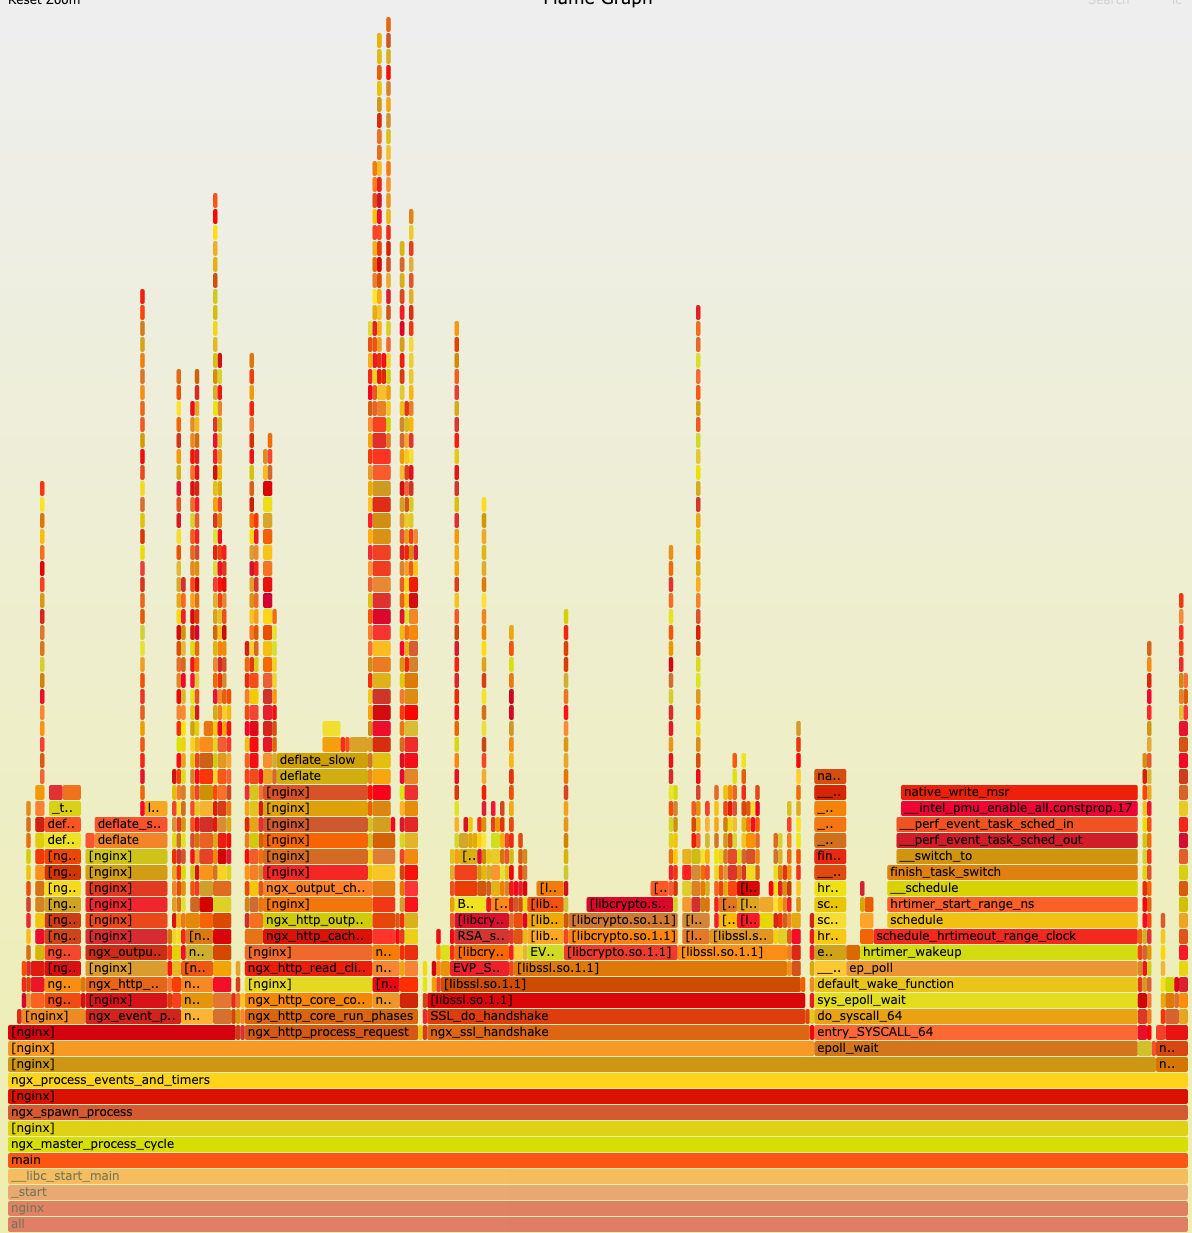
Nginx FlameGraph with dwarf
Missing symbols is the root cause. It makes your profiling result useless. It can’t tell you anything or very few things about your application/kernel. And it’s the very first problem that I met and have to solve while playing with perf or bpftrace, especially while tracing the user-space program.
If you just want to have a solution, you can stop here. Otherwise, let’s move on.
Let’s talk about symbols
A symbol in an ELF is a name of a variable or function that is associated with its memory address.
A symbol of a function is the event that we can trace / sample to get more info about what is it doing.
For example, here’s a snippet of a list of events that we can trace in Nginx ( using readelf which belongs to the Debian binutils package:
readelf -s `which nginx`
|
or a snippet of a list of events that you can trace for the Linux kernel:
cat /proc/kallsyms | egrep ' (t|T) '
|
So, symbols are critical for event tracing which used kprobe/uprobe. Without knowing the name of the function we want to probe, we can’t probe, obviously.
For quite a long time, I thought that the symbols that we use to trace are debugged symbols, which exist in your binary when you compile it with -g but that’s not true. ( Feel free to correct me if I’m wrong here, I would love to know more about this )
Let’s examine a simple C code:
#include <stdio.h>
|
Compile it in my Debian 10 VM, without -g
gcc symbol.c -o hello
|
There are no debug symbols:
[root@tungdam10-virt.dev:~]# objdump -h hello | grep debug
|
We still have a symbol for our hello function name like this
readelf -s hello | fgrep hello
|
Let’s try tracing that hello event by
bpftrace -e 'uprobe:./hello:hello {printf("%s",ustack)}' -c ./hello
|
(here I use bpftrace because it’s easier to write a one-liner for event tracing. Don’t worry about the command or syntax much)
Yeah, we still can catch it.
So, for function tracing, we don’t need debug symbols, we just need symbols, which are entries of type FUNC listed in 2 tables of readelf -s command output:
.dynsym ( dynamic symbols, which can be used by another program
.symtab ( “local” symbols used by the binary itself only )
Usually, the “local” symbols are stripped from a binary ( for reducing binary size only, AFAIK ) and those symbols are provided in a -dbg or -dbgsym packages.
For example, in the case of Nginx, the binary was stripped
[root@tungdam10-virt.dev:~]# file `which nginx`
|
And we can see .dynsym only, no .symtab
[root@tungdam10-virt.dev:~]# readelf -s `which nginx` | fgrep 'Symbol table'
|
It’s not a very big deal as we still have quite many events to trace ( dynamic FUNC symbols that shouldn’t be stripped ) but we may miss something which is interesting. Fortunately, in most distro, Nginx provides nginx-dbg that contains more symbols for us to play with. It’s just not the case with all other software.
Let’s try stripping our hello binary to see what happens?
strip -s ./hello
|
Our symbol is gone
[root@tungdam10-virt.dev:~]# readelf -s hello | fgrep hello
|
And we can’t trace it anymore:
[root@tungdam10-virt.dev:~]# bpftrace -e 'uprobe:./hello:hello {printf("%s",ustack)}' -c ./hello
|
Then, why do we need DEBUG SYMBOLS?
Debug symbols are information, which obviously, for debugging purposes, that tell us more info about symbols:
- Interpret a memory address to a line of original source code
[root@tungdam10-virt.dev:~]# objdump --dwarf=decodedline hello
|
Here is the address 0x1145, which is our hello function as we can see here:
readelf -s hello | fgrep hello
|
is defined in line number 3 in our source code.
I personally find this not very helpful, as we can browse through the source code and grep the function name to read more about it. But we still need it for a much more important purpose.
- Stack unwinding
This is the killer feature of trace tools, show us the stack traces or activation records of a function, which answers the question: which function triggers which functions that lead to a function that I care about (maybe, it’s slowing my server down)
Let’s take a look at another simple code like this, let’s call it funk.c:
#include <stdio.h>
|
Compile it with -g which enables debug symbols in DWARF format. (We won’t talk much about it here but I found this article very helpful if you want to read more about it)
gcc -g funk.c -o stack
|
Add an uprobe by perf (because bpftrace doesn’t support DWARF stack unwinding) so we can trace it
[root@tungdam10-virt.dev:~]# perf probe -x ./stack 'func_d'
|
A stack trace for func_d looks like this:
[root@tungdam10-virt.dev:~]# perf script
|
As you see, from here we know that the activation records are like this: main() -> func_a() -> func_b() -> func_c() -> func_d()
This basically is the idea we rely on to build a cool FlameGraph like this:
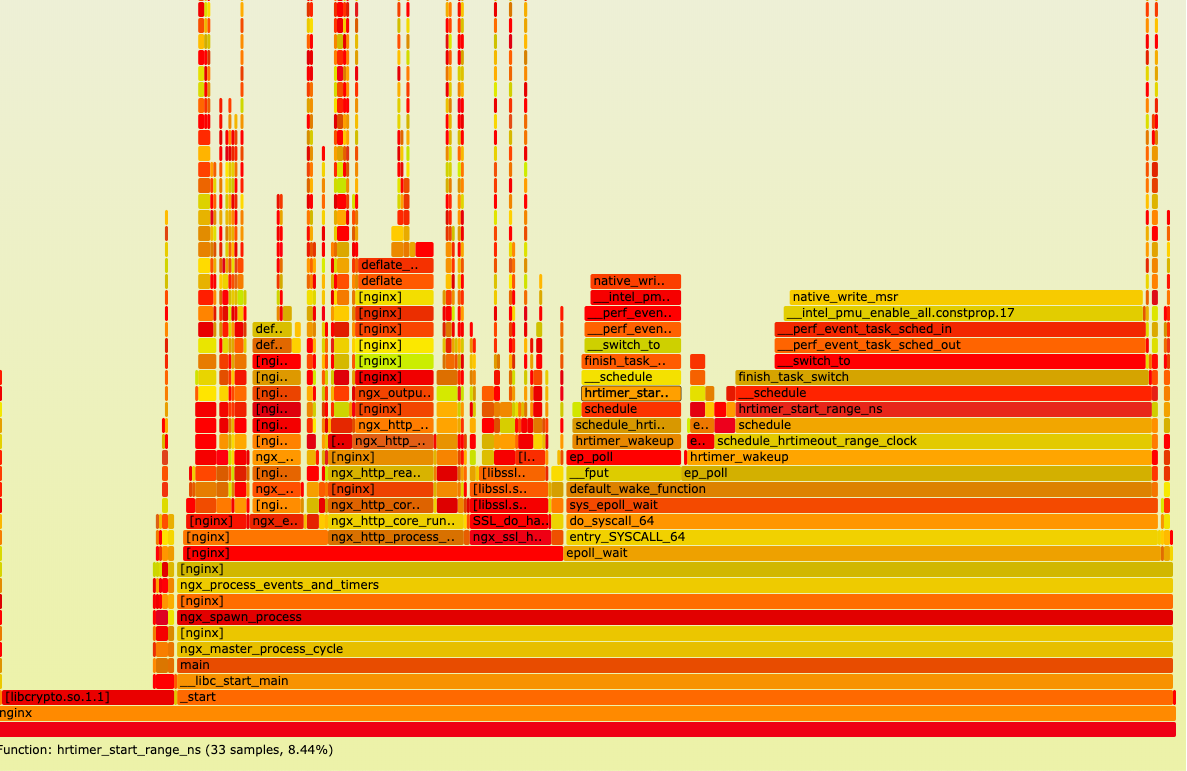
Okay, looks nice. So debug symbols are cool, and DWARF is cool. And it’s quite a popular practice that software compiled with -g so we can use this stack unwinding technique.
But there are some limitations with DWARF:
- Its size is usually too big
- BPF-based tools can’t use it as a stack unwinding technique (so maybe it’s the limitation of BPF-based tools :D )
We should finish here. But I’m not tired yet. So stay with me for a bit more.
There’s another stack unwinding technique, using a frame pointer. This is definitely not my area but let me try to explain it in a very simplified way:
- A stack trace (or activation records or call stacks) contains many frames, which are saved in the Last In First Out (LIFO) structure. That’s why we called it stack frames.
- Each frame, in turn, contains info about a state of a function when it’s executed (address of a memory area that stores its parameter, local variables, return address)
- The frame pointer is…. Ok, seriously, I don’t know. Let’s see how a professional guy explains it here. I will quote the key part:
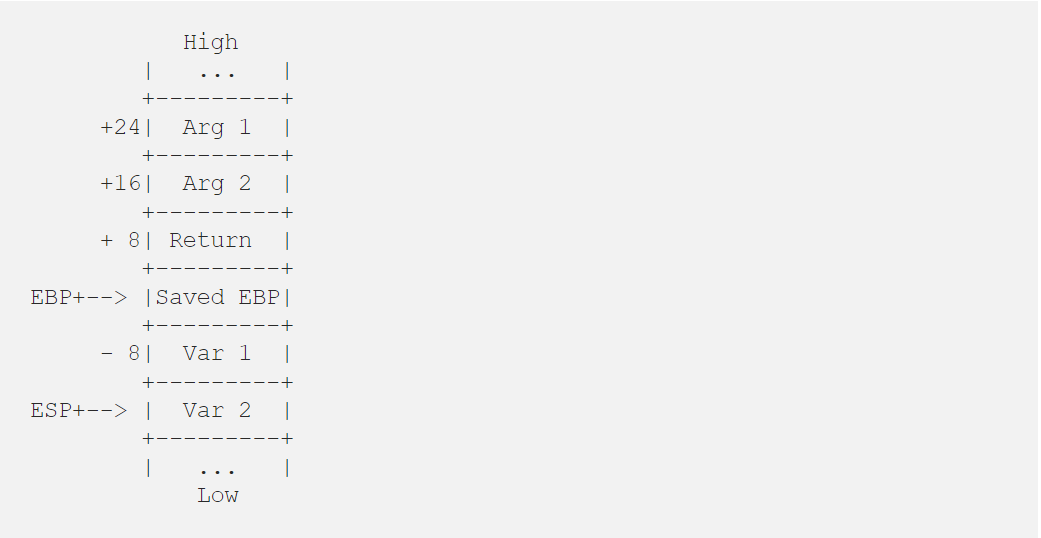
| As you can see, the frame pointer for the last stack frame is stored at the start of the current stack frame, creating a linked list of frame pointers. The stack is unwound by following this linked list.
So, basically, a frame pointer can get us to the memory address (thus by some dark magic with assembly, offset, and CPU register, we’ll have all the needed info about different frames in a stack), which can give us a full-stack strace.
This is the default stack walking for the call-graph method by perf and so far the only stack walking technique supported by bcc-tools or bpftrace (they depend on frame pointer but have their own BPF helper and map storage to store info about stacks)
Let’s see how it looks like with our stack program (funk.c source code above)
[root@tungdam10-virt.dev:~]# perf record -e probe_stack:func_d -aR -g --call-graph fp
|
Note that now we are using fp frame-pointer stack walking method, not dwarf anymore.
Same stack trace but with bpftrace and its ustack function (to get the user’s stack trace):
bpftrace -e 'uprobe:./stack:func_d {printf("%s\n", ustack); }'
|
Let’s compile our funk.c without -g to see what will happen:
[root@tungdam10-virt.dev:~]# gcc funk.c -o stack
|
still cool. Well, who’ll need debug symbols now?
There are several points:
- For optimization purposes, the software is usually compiled with -fomit-frame-pointer flag, which makes it impossible to use the frame-pointer as the stack walking method anymore. For example, in our case:
[root@tungdam10-virt.dev:~]# gcc funk.c -o stack -fomit-frame-pointer
|
Only 1 function symbol, and no call stacks anymore.
Unfortunately, in many systems, this is the default option, especially with a big software that is very performance sensitive, like C standard library (libc6 in Debian) for example, or Java JVM. That’s why we still have an unknown symbol like 0x41fd89415541f689 in many of our examples using frame pointer stack unwinding. (Because libc doesn’t have a frame pointer to unwind to resolve the symbol of __libc_start_main function, which is _start the function that you can read more about here)
(But somehow it’s very tricky for my case, gcc (Debian 8.3.0–6) 8.3.0 preserve frame pointer by default. To disable it, we have to set it explicitly using -fomit-frame-pointer)
I’m still waiting for the Debian maintainer to change it, by using -fno-omit-frame-pointer instead, but it looks like it’s not going to happen very soon. See this.
- Somewhat I currently find unwinding by DWARF is more stable. I lied to you in the examples above while using bpftrace. We have 4 functions, but bpftrace only shows 3 of them in the stack call, due to this bug. Or I have to let my programs sleep a bit, otherwise, bpftrace trace won’t be able to resolve the symbol correctly, due to this and this.
- In the world of C, compile with -g is much more popular than fno-omit-frame-pointer, thus DWARF can be used for most cases.
- Whatever the stack unwinding method, eventually it’s software, it must have bugs some day, having more than 2 options for comparing is always good.
Conclusion
We have come a long way, so far, hopefully, you can understand:
- Symbols, debug symbols, stack strace, and stack unwinding concepts
- Which symbol ( = event ) we can trace by examing its binary
- How should we compile our binary to have symbols for tracing
- Which package we should look for to overcome the missing symbols situation
- Some basic bpftrace commands that we can use to trace a specific function
All of these can help us to develop a very helpful strategy for debugging software in production later. I will write about it very soon if this article makes you happy enough.
Thanks for reading!
***
For many articles on tracing and stories of the everyday working of Mr. Tung Dam, Cốc Cốc Head of Infrastructure and Support Department, please continue to be notified on our latest blog!
For more of Mr. Tung Dam's sharing: