


Why do SREs (Site Reliability Engineer) use SLO (Service Level Objective)?
SLO is a practice to estimate how good our system is or to detect health issues of the system from the engineering point of view. It defines “thresholds” indicating that the system serves end-users “good enough”. SLO may not bring a lot of value when the system is running stably or, in other words, satisfying users the way we see it from the “surface”. However, if we want to measure what we see more accurately we need to collect Service Level Indicators (SLI).
There is no problem when the system runs stably as we hope. It will be more difficult when the system extends over time. At that time, the complexity will linearly increase with the risk that the system will meet. Showing problems before it happens helps SREs to have a better strategy to response, so they will focus on metrics around SLO.
Idea of Error Budget and Burn Rate
Error Budget (EB) is calculated from SLO. An EB is the amount of error that your service can accumulate over a certain period before your users start being unhappy. It makes sense that our first step is to define a warning of how much EB will be burned in the next X days, it is Burn Rate.
The key concept is that, at a specific time, the amount of burned EB will be proportional to the severity of the problem encountered. The more the amount of EB burned, the more concerned the issue.
What does this mean?
For example, we have a cycle to evaluate SLO is 28 days (time_window=28d) and our SLO defines that 99.9% (SLO = 0.999) received requests will be handled successfully by the server.
-> EB = 1 - SLO = 1 - 0.999 = 0.001
This is the request ratio is allowed to fail in 28d time window. Assumed that, within this period, we receive 1,000,000 requests. According to the target that we have set, there can be only 1,000 failed requests and 999,000 successful ones.
If our system runs as expected, then after 28 days, 100% EB will be exhausted. This means Burn Rate = 1. This is the perfect case.
-> When outages occur with the system, we found that it will exhaust 100% EB after the 14 days (1/2 time_window) -> burn rate = 2
At this time, we can show charts corresponding between time window and Burn Rate (with time_window = 30 days in below image).

The SLO target being set will be considered passed if, in a time window, the amount of EB does not “exhaust” earlier. This idea is based on EB amount consumed corresponding with BR (Burn Rate) in “perfect case” to estimate system health could be worse.
-> The higher the burn rate, the faster EB exhausted -> the greater the risk.
From there we can see evaluating periodically and alert problems related to EB consumed is necessary.
How to evaluate and alert periodically is arising the question now. The following plan we can use to show the EB threshold consumption to alert when the service has problems.
How to calculate the Burn Rate
SLO = 1 (100%) in 28d corresponds to 672h uptime (always up and not include any incidents in 672h). However, this story is completely unfeasible. So, the practical SLO will be smaller than 100%.
As mentioned above, we set SLO = 0.999 (99.9%) in 28 days (about 4 weeks) period, this is equivalent to:
28 * 24 * 0.999 = 671.328h uptime => allow 0.672h (~ 40.32 minutes) downtime in 28 days period.
=> Error Budget (EB) = 0.001 (0.1%) => 40.32 minutes in 28 days.
We found EB; next we define the threshold for EB consumed.
Following the idea that we discussed above, we will try to solve the task as follow:
“Determine that the system is looking for a problem worth paying attention to when the amount of EB consumed in 1 hour time windows is greater than 5%.”
Analysis:
We have full Error Budget (EB) in 1 cycle of 28 days = (40.32 minutes). Following the perfect case, average an hour we are allowed to use maximum:
40.32 * 28 * 24 = 0.06 minutes (~3.6 seconds) downtime <=> 0.1488% EB/hour
So, we can try to set threshold with value > 5% EB (~2 minutes) to firing an alert.
100% EB corresponds to about 40 minutes. At this point, we need to define the downtime range so that the service does not affect the previously defined SLO.
With 5% EB per hour -> We can calculate the burn rate:
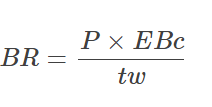
With:
- BR: Burn Rate.
- EBc: Error budget consumed.
- P: Period for SLO eval.
- tw: Time window. In this case, tw = 1h.
From there, we calculate the burn rate limit with 5% EB consumed per hour and we can configure alerting rule by Burn Rate:
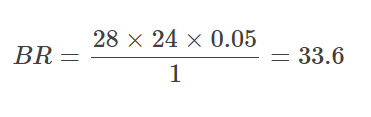
Rule config:
expr:

ErrorRate[1h] < 33.6
However, there is one problem occur:
33.6 times in 1 hour is fit to decide whether the service consumes EB significantly compared to the EB we have set. But, if EB consumed just a little bit lesser than 33.6, there will be no alert (for example, ER = 33) although it burned 100% EB in 20.3h*.
With BR = 33, we calculate the Error Budget consumed:
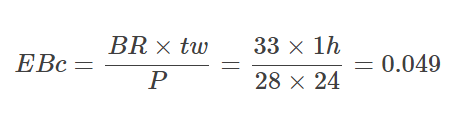
And then, we have time to consume all budget:
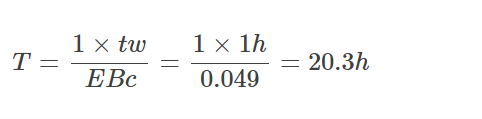
This can be overcome by using an additional short time-window to detect problems that occur briefly but cause a significant consumption rate and this requires a quick response. Additionally, the short window time helps to ensure that the chart recovers quickly when the problem is resolved.

As recommended, we could use a short time-window = 1/12 a long time-window with the same burn rate.
Therefore, it is recommended to add an evaluation condition for a short time-window to help detect problems that burn EB significantly.
Rule config:
expr:

ER[1h] < 33.6

OR

ER[5m] < 33.6
From there, we can see the use of a long time-window to identify the risks of EB consumption in the future to act when that situation continues in the coming days. While a short time-window is used to detect problems that have a significant impact on the system and need to be resolved as soon as possible.
Reference: